When your Data Narrative is Unclear: Anon. TRIO/G.U. Programs

Shawn Dean
2024-10-23 · 10 Minutes
Reference: Some of the support programs I am discussing will be renamed anonymously out of respect for those programs. If you seek to inquire further, reach out to info@innovateforcalifornia.org Data narratives can be equivocal at times, have multiple possible meanings or interpretations, leaving the narratives open to various understandings. True meanings of data narratives can be nuanced and subtle enough to leave room for ambiguity, which is dangerous to any agency dealing with a form of Program Review. This leaves Directors, Coordinators and Advisors of Local Educational Agencies (LEAs), Institutions of Higher Education (IHEs), and TRIO Programs collectively as Education Agencies (E.A.s) for this blog with a difficult decision to make. They must choose between offering tiered services to students who need them most or focusing on students whose success would yield the most favorable results in annual progress reports.
For TRIO programs, this decision may involve prioritizing resources for tutoring versus other services, such as college advising or comprehensive mentoring. We will explore the diminishing returns of tutoring later in this discussion. For LEAs and IHEs, the choice often comes down to whether to support less successful students to help them remain in their programs or to allocate resources toward higher-performing students by finding alternative options for those struggling.
Wouldn't it be ideal if there were a way to quantify which students would benefit most from various services, regardless of their specific needs?
To be less broad stroking, let us explain how most organizations who are awarded money by federal grants have to go through some form of yearly audit. When E.A.s are going through their auditing period, they must present a data narrative that compliments their work and proves that they are meeting the grant requirements for what the grant was funded. Without it, auditors are left to make up their own narratives of what the data says, which, in my experience, is rarely in the favor of the organization. This situation becomes more apparent when you apply principles of data analysis to it.
To be even more specific, let us compare the data narratives of an Upward Bound(U.B.)(cite source) with the College and Career Indicator Metric within the California Dashboard that affects all schools around California(cite source) and to the School Accountability Report Card (SARC) (cite source). Below, you will see the table that shows their shared common goal in Column one, the Upward Bound's project objectives in column two, the CCI Indicator qualifications in column three, and the SARC Report Pupil Achievement and Pupil Engagement Metrics in column 4. As you can see, the objectives of all three programs and initiatives have alignment:
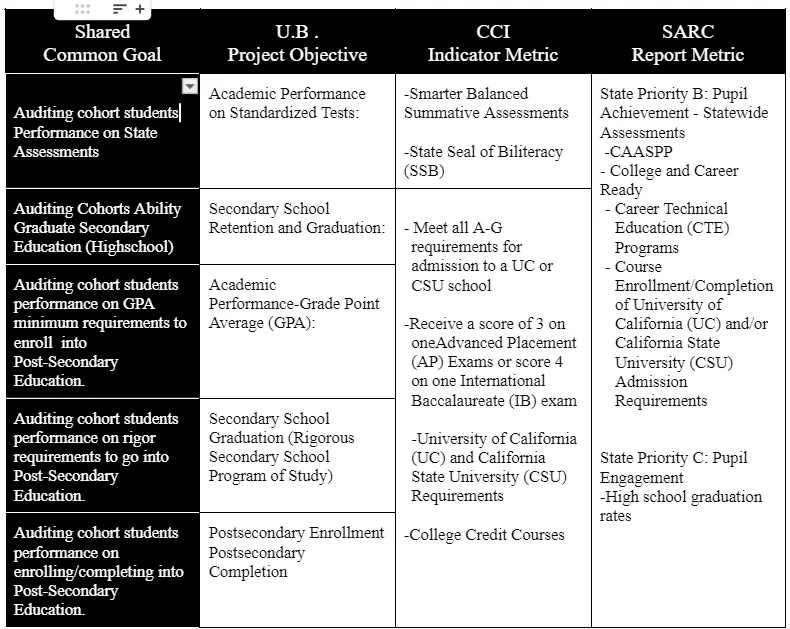
Note: The merge row shows where one goal has multiple alignments, such as a School’s attempt to meet or exceed its CCI Indicator goals or SARC requirements goals, which will also fulfill the Project Objective goals of a UB Program.
This is all important because without an E.A. mastering the narrative of their data, they run the risk of their work and effort in students looking more equivocal than the data narrative they submit. A school could already be trying to meet the metrics they must meet without any data analytical proof to say outside forces contributed to that outcome, or vice versa. Let us dive into Data Analytics and explain further.
Let's Get Down to the Data Analytics
Since a typical school is already trying to meet the same metrics that TRIO programs try to implement, it is very important to show a distinction between what they do to help students versus what a school is already doing. To see an example of this let us analyze what our resident Data Analyst, Shawn Dean, did for a GEAR UP Program he was servicing. He Analyzed the likelihood of students attending academic counseling having any association with the grades necessary to meet stated goals over time, which has informed Innovate For California's current Learning Analytics Modeling,
When he was working with a GEAR UP program to analyze data, he was initially excited because their data seemed to match the data coming from the College and Career Readiness Consortium.
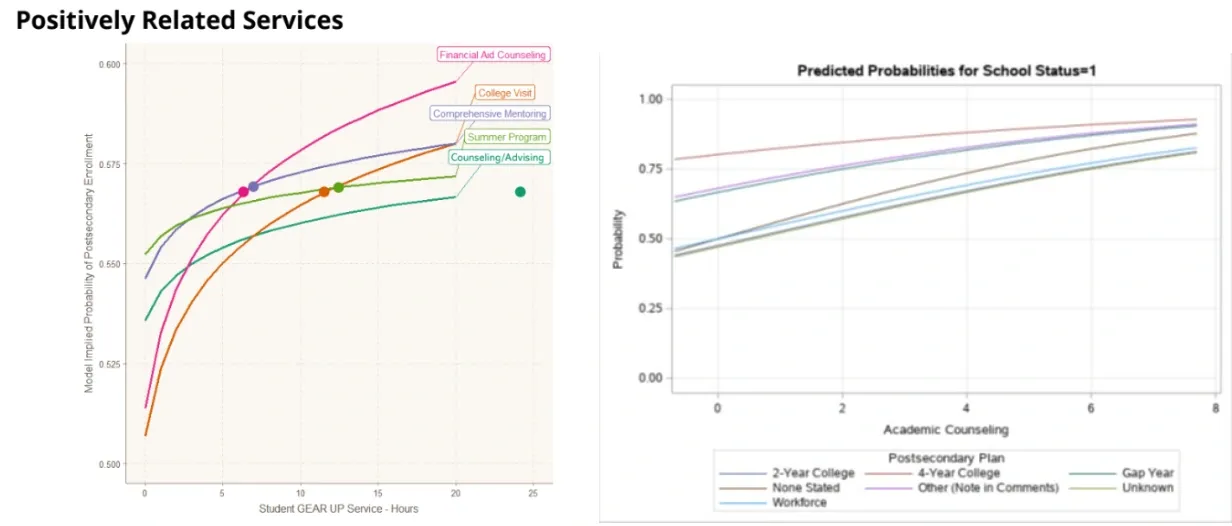
Note: In his initial finding, Shawn noticed that the rate of hours associated with academic counseling the GEAR UP program conducted mimicked or exceeded the positively related services modeled within the College and Career Readiness Consortium’s logistic regression modeling.
However, when doing a deeper dive into the analytics, he began to see a problem with the data narrative within the data he had been given. The best way to explain discrepancy was to do an analysis of likelihood for the possibility of students attending academic counseling and having the grades necessary to meet stated goals over time. He feared that, while the logistic relationship model he created using the GEAR UP data followed similar trends set out by the College and Career Readiness Evaluation Consortium, traditional data Analyst of this data would lead a data scientist to believe the relationship between services offered and students having the GPA necessary to meet stated goals to be random simply because the overall hours of provable amounts of service is so low.
blog-images-2025/Findings.webp
The 2-year and 4-year college analyses show that the services rendered to students over time do not significantly impact student outcomes statistically. In both cases, the p-values are well above the threshold for significance, indicating that the effects observed could easily be due to random chance. Additionally, while the standard deviations reflect the variability in the data, they do not change the conclusion that the services rendered do not appear to influence student outcomes at either type of post-secondary goals meaningfully.
To get even more specific, let's dive into the 4-year institutional goals and 2-year institutional goals; the data outcomes for the rest of the categories are about the same:
-
If a Student stated they wanted to go to a 2-year program:
-
The Wald Chi-Square value of 0.0158 is very small, indicating that the estimated effect of services rendered to students on their outcomes is not large.
-
The corresponding p-value of 0.899 is very high, meaning there is an 89.9% chance that the observed effect could simply be due to random variation rather than any real impact of the services provided.
-
This p-value is well above the common significance threshold of 0.05, suggesting that the relationship between the services and student outcomes is not statistically significant.
-
This data strongly suggests that the services rendered for students seeking a 2-year academic college do not have a meaningful impact on student outcomes.
-
The effect is likely due to random chance, and it cannot be concluded that the services provided lead to improved student outcomes.
-
The standard deviation measures how spread out the data is around the mean effect. A value of 0.7578 indicates moderate variability in the data, meaning that individual student outcomes vary around the average effect.
-
While this variability is not particularly high or low, it provides no direct information about which type of students they are serving.
-
Ultimately, in the case of students who received academic services to reach 2-year colleges, the very small Wald Chi-Square and large p-value indicated that the variable (services rendered) is likely to have no real effect on student outcomes.
-
Therefore, it appears that the relationship between services and outcomes could simply be due to random variation, and the effect is not statistically significant on student outcomes.
-
If a Student stated they wanted to go to a 4-year Program:
-
The Wald Chi-Square value of 0.5175 is still relatively small, indicating that the estimated effect of services rendered is weak.
-
The corresponding p-value of 0.4719 means that there is a 47.19% chance that the observed effect is due to random variation.
-
Since the p-value is much higher than the 0.05 threshold for statistical significance, we again cannot reject the null hypothesis.
-
This suggests that the services rendered to students at the 4-year college do not have a statistically significant effect on student outcomes.
-
The services rendered to students seeking academic counseling to reach the 4-year college do not appear to have a significant impact on their outcomes.
-
Without any explanation or chance to give a rebuttal, this GEAR UP program would be misconstrued as merely having an association with the students who were already likely to go onto their stated post-secondary plans while having no real effect on said student's outcome, due to the low number of hours that they could provide for analysis. If the data given to Shawn were the only data provided to auditors, this would endanger their funding. However if this program was serving students with fidelity one would assume the gap in data collection would be a matter of not keeping track of the services offered. As they are thriving well, they must have provided more data on the contrary, which underscores the value of owning your data narrative.
To ensure that a program's impact is accurately represented, it's crucial to present a comprehensive and compelling data narrative beyond basic statistical analysis. Simply relying on traditional metrics may not capture the full extent of your efforts or the unique circumstances surrounding your program. By crafting a well-rounded narrative that highlights qualitative insights, additional evidence, and context-specific factors, you can better demonstrate the true value and impact of your services. This approach not only strengthens a case during audits but also supports the sustainability and growth of your program and allows E.As to identify which students would benefit the most by offering them tiered support services.
If you need help building a strong data narrative that effectively communicates your program's success, feel free to contact us at info@innovateforcalifornia.org.